Analytics
Track your chatbot's performance with detailed analytics and insights.
The Analytics Dashboard provides comprehensive insights into your chatbot's performance, user interactions, and content effectiveness. Use it to understand how your chatbot is being used and identify areas for improvement.
Accessing Analytics
To view your chatbot's analytics:
- Navigate to your chatbot from the dashboard
- Click on Analytics in the sidebar navigation
- The analytics dashboard will load with data for the selected time period
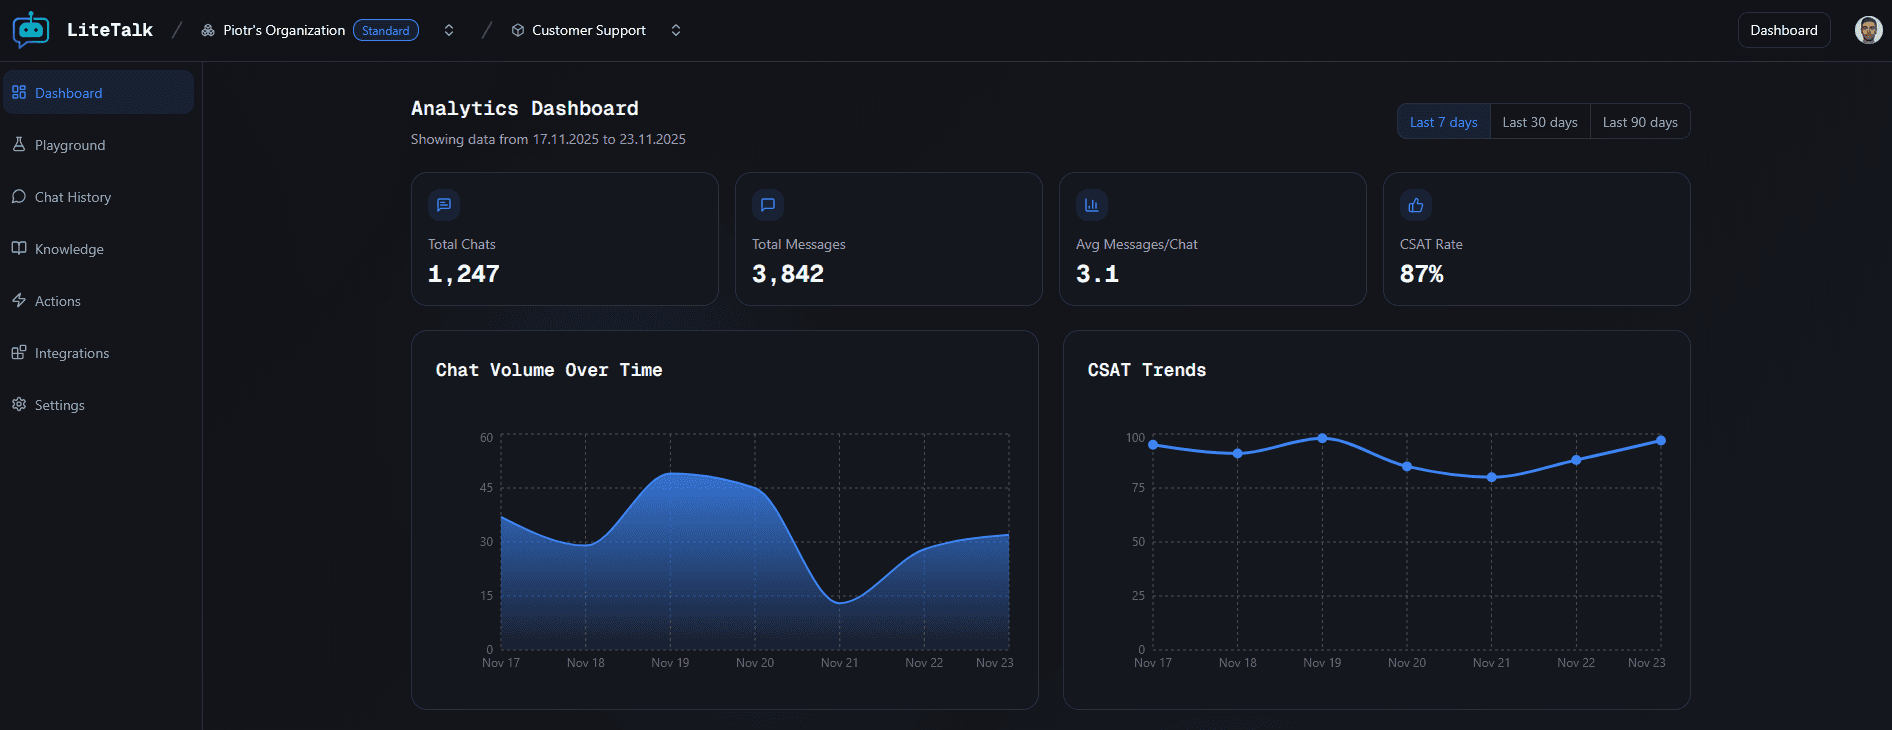
Date Range Selection
At the top of the dashboard, you can select a time period to analyze:
- Last 7 days - View data from the past week
- Last 30 days - View data from the past month (default)
- Last 90 days - View data from the past quarter
The date range selector shows the exact date range being displayed below the page title. Click on any time period button to update the dashboard with data for that range.
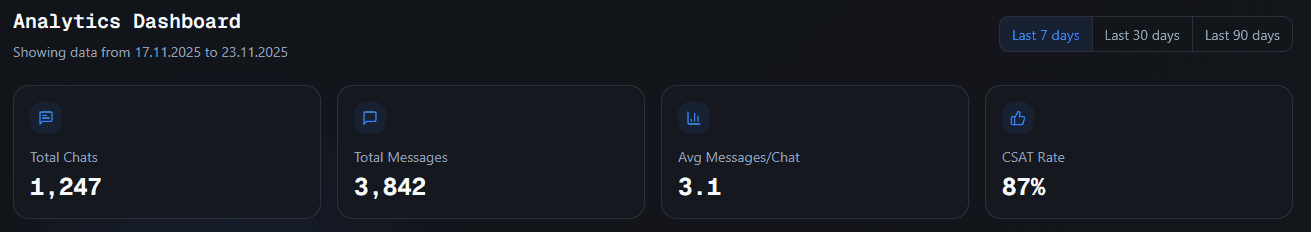
Key Performance Indicators (KPIs)
The dashboard displays four key metrics at the top:
Total Chats
The total number of chat sessions started by users during the selected time period. This shows how many conversations your chatbot has engaged in.
Total Messages
The total number of messages exchanged across all chats. This includes both user messages and chatbot responses.
Avg Messages/Chat
The average number of messages per chat session. Higher values may indicate more engaging conversations or users asking follow-up questions.
CSAT Rate
Customer Satisfaction (CSAT) rate as a percentage. This shows how satisfied users are with your chatbot's responses based on their feedback.
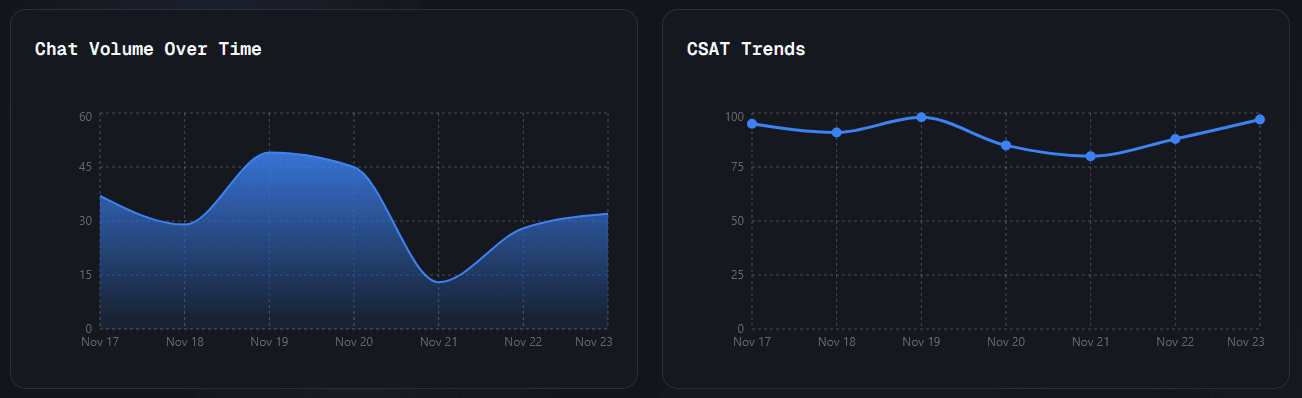
Charts and Trends
Chat Volume Over Time
A line chart showing the number of chats over the selected time period. This helps you identify:
- Peak usage times
- Trends in chatbot engagement
- Daily or weekly patterns
CSAT Trends
A chart displaying customer satisfaction rates over time. Use this to:
- Track satisfaction improvements
- Identify periods with lower satisfaction
- Monitor the impact of chatbot updates
Advanced Analytics (Pro Feature)
Advanced analytics features provide deeper insights into your chatbot's performance. These features are available for Pro plan users.
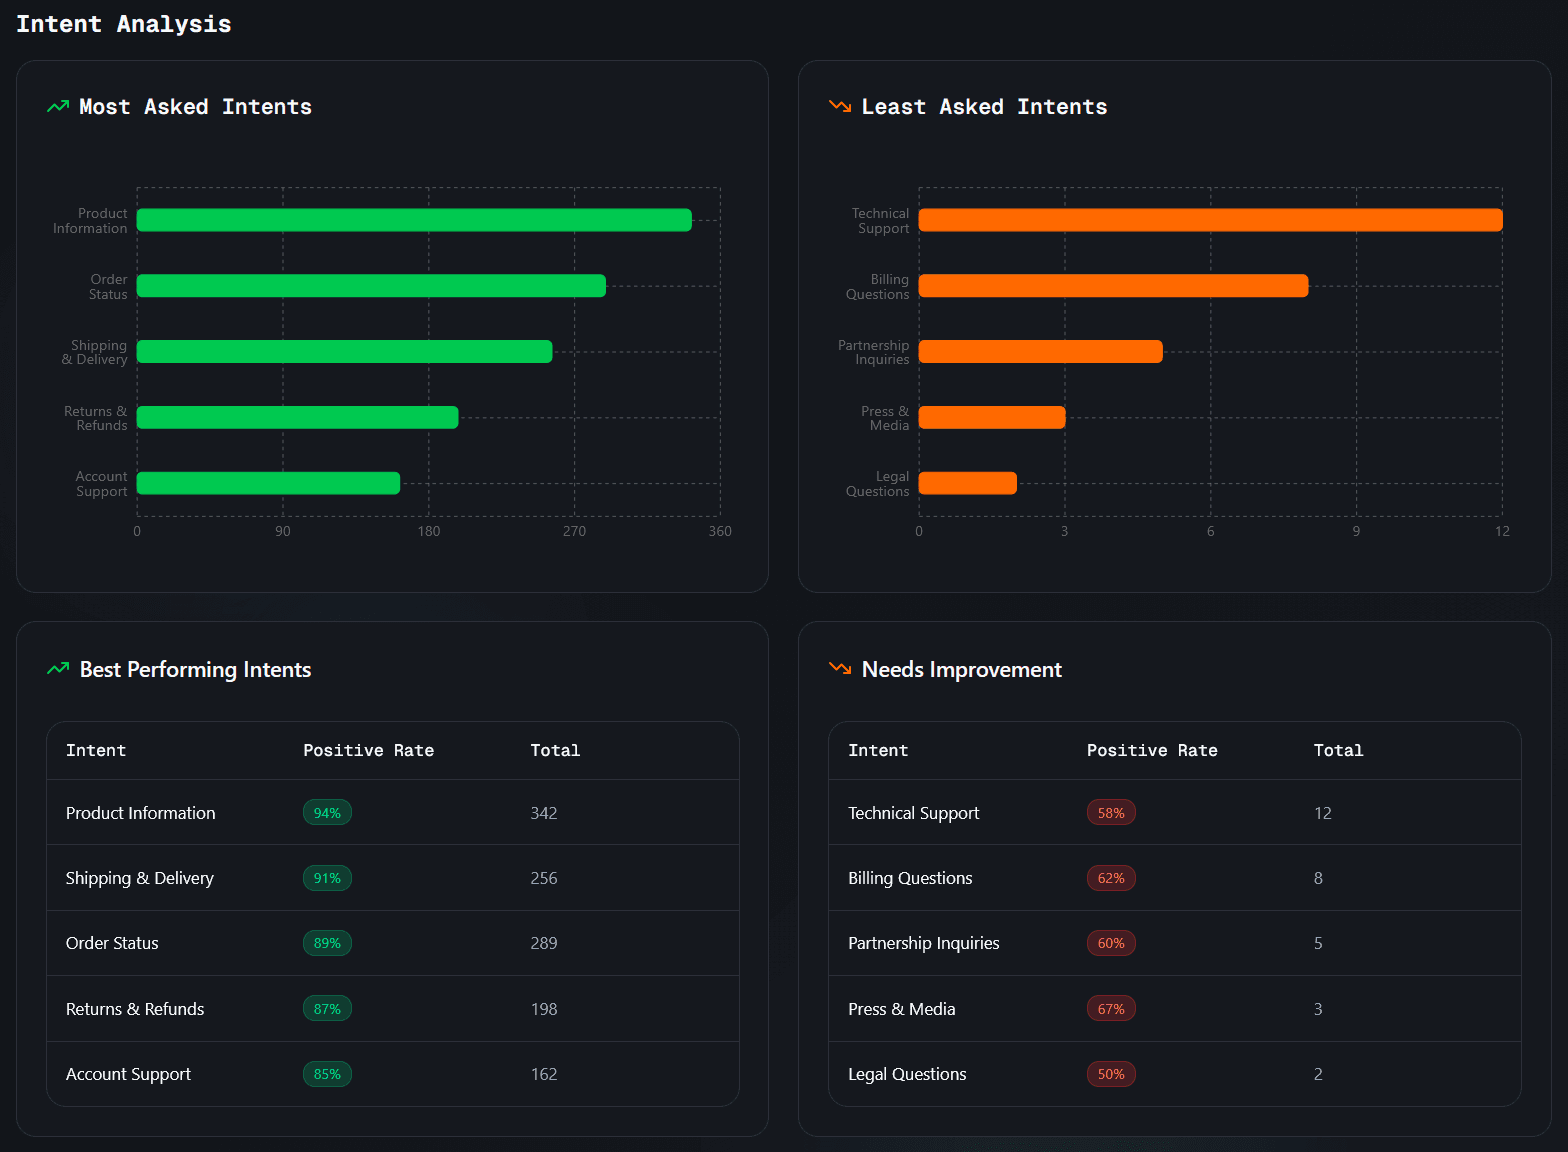
Intent Analysis
Intent analysis helps you understand what users are asking your chatbot:
Most Asked Intents - Shows the topics or questions users ask about most frequently. This helps you identify:
- Popular use cases
- Common user needs
- Topics that might need more content
Least Asked Intents - Shows topics that are rarely asked about. This can help you:
- Identify underutilized content
- Understand content gaps
- Optimize your knowledge base
Intent Feedback Tables - Detailed tables showing:
- Best performing intents (highest satisfaction)
- Worst performing intents (lowest satisfaction)
Use this feedback to improve responses for specific topics.
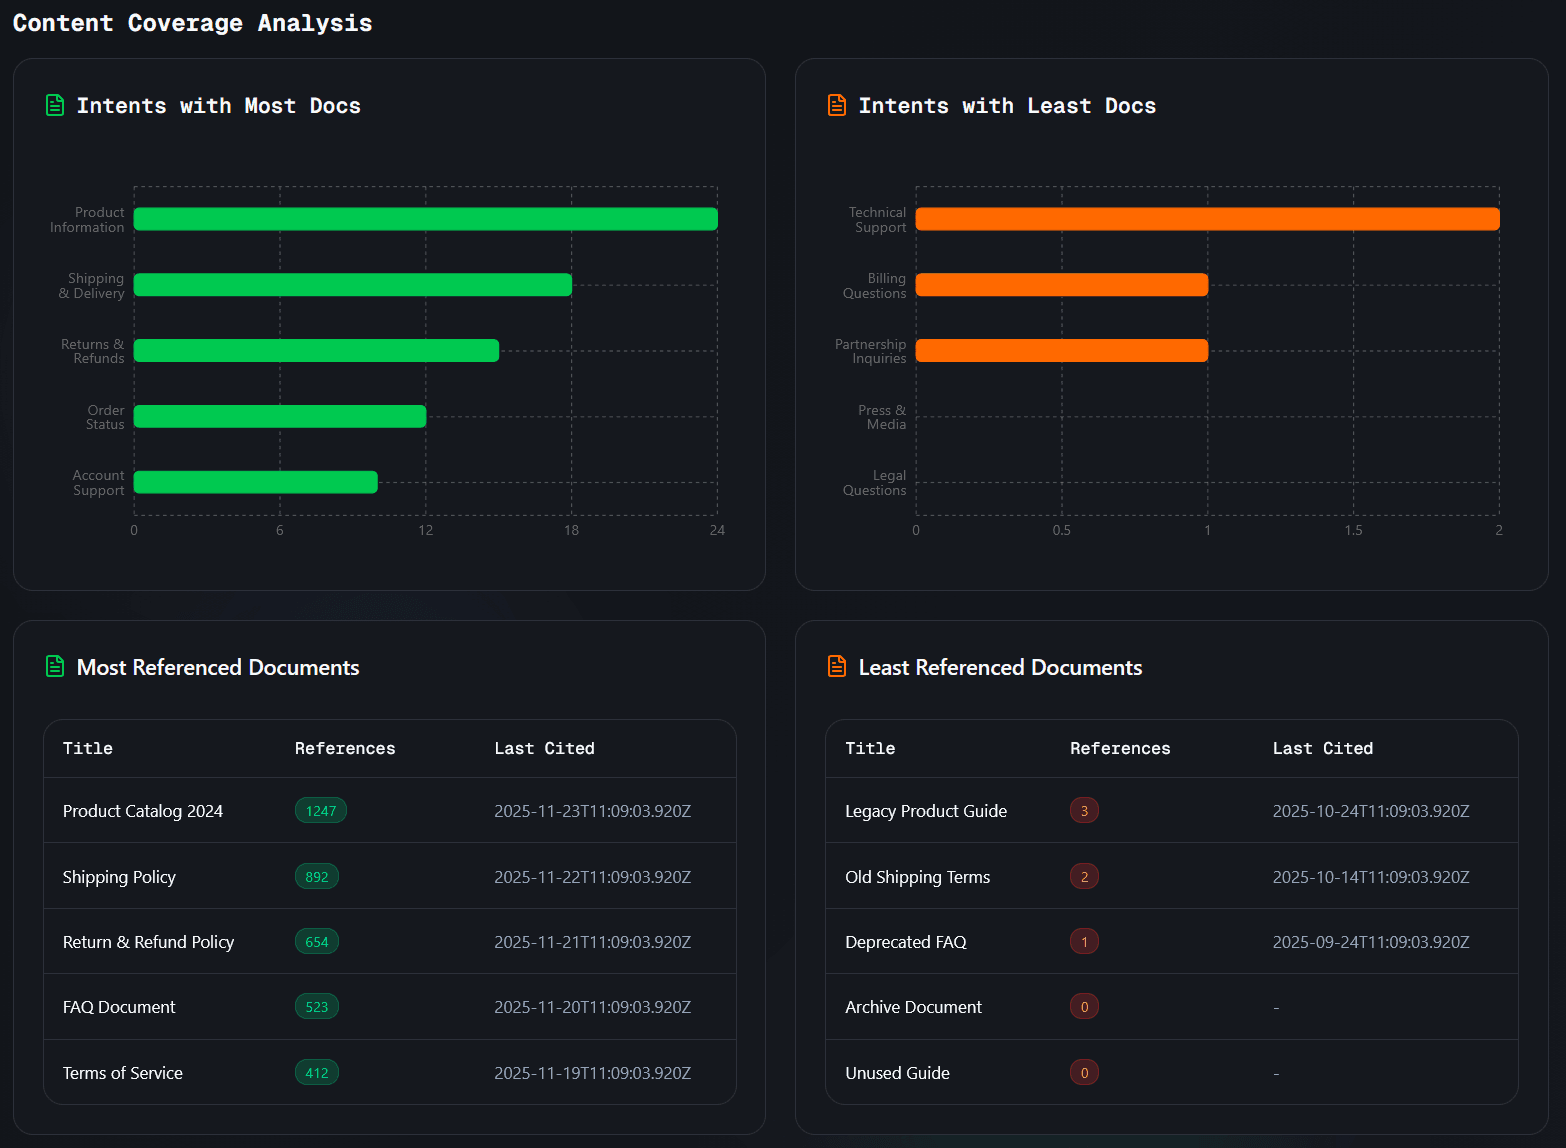
Content Coverage Analysis
Content coverage analysis shows how well your knowledge base covers user questions:
Intents with Most Docs - Topics that reference the most documents in your knowledge base. This indicates well-covered topics.
Intents with Least Docs - Topics that reference fewer documents. These might need additional content.
Referenced Documents Tables - Shows which documents are:
- Most referenced by the chatbot (most useful)
- Least referenced (may need updates or removal)
This helps you understand which content sources are most valuable and which might need improvement.
Understanding the Data
Interpreting KPIs
- High chat volume - Indicates good chatbot adoption
- High messages per chat - Suggests engaging conversations
- High CSAT rate - Shows users are satisfied with responses
- Low CSAT rate - May indicate need for better responses or more knowledge
Using Charts
- Upward trends - Generally positive, showing growth
- Downward trends - May indicate issues or seasonal patterns
- Spikes - Can indicate successful campaigns or events
- Dips - May indicate technical issues or content gaps
Making Improvements
Based on analytics data, you can:
- Add Knowledge - If certain intents have low satisfaction, add more relevant documents
- Update Content - Focus on documents that are frequently referenced but have low satisfaction
- Refine System Prompt - Adjust your chatbot's behavior based on user feedback patterns
- Optimize Responses - Improve responses for intents with poor feedback
Best Practices
- Regular Monitoring - Check analytics regularly to stay informed about chatbot performance
- Compare Periods - Use different date ranges to identify trends and patterns
- Focus on CSAT - Prioritize improving satisfaction rates for better user experience
- Content Gaps - Use intent analysis to identify and fill knowledge gaps
- Document Quality - Review referenced documents to ensure they're accurate and helpful
Troubleshooting
No data showing?
- Make sure your chatbot is enabled and receiving traffic
- Check that the selected date range includes periods when your chatbot was active
- Verify that users are actually interacting with your chatbot
CSAT rate seems low?
- Review the intent feedback tables to identify problematic topics
- Add more relevant knowledge sources for low-performing intents
- Consider refining your system prompt to improve response quality
Charts not loading?
- Check your internet connection
- Try refreshing the page
- Ensure you have the necessary permissions to view analytics
Advanced features locked?
- Advanced analytics (Intent Analysis and Content Coverage) are available for Pro plan users
- Upgrade your plan to access these features
- Basic KPIs and charts are available on all plans